For the correct promotion of an account on the social network Instagram, information is required on the activity of the audience. This allows you to properly organize the publication processes, connect, if necessary, additional tools to increase popularity.
For this, the system reads and provides in an understandable form information concerning the actions of users. It is important not only to obtain such data, but also to interpret them correctly and take measures to improve the situation.
What information is important
There is a point of view that convinces us of the need to pay attention only to the total number of users who have appeared on the page. However, these data cannot show many contributing factors. Therefore, first you need to find out a number of parameters:
- Actions. This is an indicator that includes quantitative measures – the number of impressions and the total audience coverage of all published posts. If necessary, the parameters can be specified by delimiting all data by time.
- Audience. The parameter characterizes the main features of the users who have appeared on the page. This is not only their age, but also the main geo-locations, as well as the amount of growth over the set period. The data will help to form a portrait of the target customer, which will improve understanding of interests.
- Content. Includes absolutely all information related to publications. The information helps you calculate the topics that are most interesting to users, the post times that are popular and responsive, and an accurate characterization of each post.

All of the above information is available in the main menu, which you can find yourself. It is located in the upper right corner of the page and is shown in the profile by three horizontal stripes. A separate line of statistics will provide an opportunity to get all the data listed above.
Content
The easiest question to understand is content. In this section, you can view all the information that applies to each publication. At the same time, this can be approached not only using the statistics tab on the main page, but also by opening the menu of a separate publication. A separate button will be visible at the bottom.
From the available information, you can get indicators:
- Impressions, which characterizes the total number of users who saw the post. Not only subscribers are counted, but also those who found information through recommendations, reposts, targeted advertising. At the same time, Instagram independently reads how many of all the transitions were made by those who are not subscribed to the profile.
- Reach is a slightly different metric that characterizes views. That is, to go to this sub-item, you need to open the publication and view it. In some cases, the indicator drops sharply due to the so-called shadow ban, but it can be restored by increasing the quality of the materials.
- Followers – the number of unique pages that want to become followers after viewing the post.
- Interaction. This is the most important metric not only for posts, but also for stories. It is from the activity that appears on the page that its position in promotion increases. Often, bloggers try to develop unique and interesting content for promotion, and also pay attention to the need to prove themselves: to speak out, put a heart and similar actions. The classic way has become the option when the publication ends with a question addressed to people.
The last parameter is the most revealing. It helps to understand how high the involvement is, to identify topics that raise interesting issues. Impressions are also adjusted by targeted advertising, but it will be characterized by meaningless if, when the specified parameter is increased, the reach remains in place. This indicates a low level of content.
Actions
In addition to reach and impressions, which were mentioned above, the parameter helps to determine how many unique users went to the page during the week, and also visited the site.

The first of these indicators gives an understanding of whether the new publication has caused a resonance or went unnoticed.
The second parameter also provides information whether a transition was made to the profile page specified in the profile header. It also further gives an understanding of how much the post has generated interest in the product or service that is offered on the page.
Audience
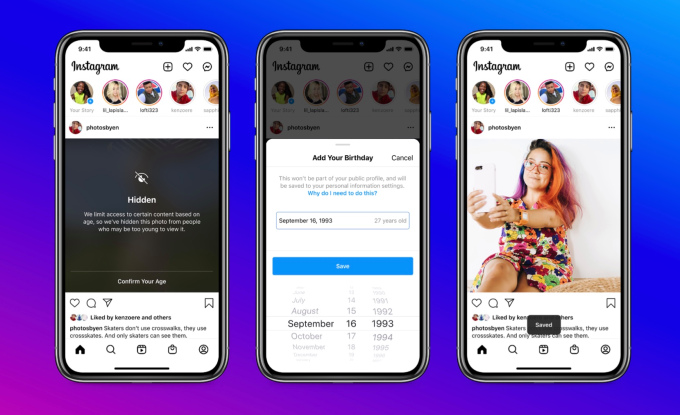
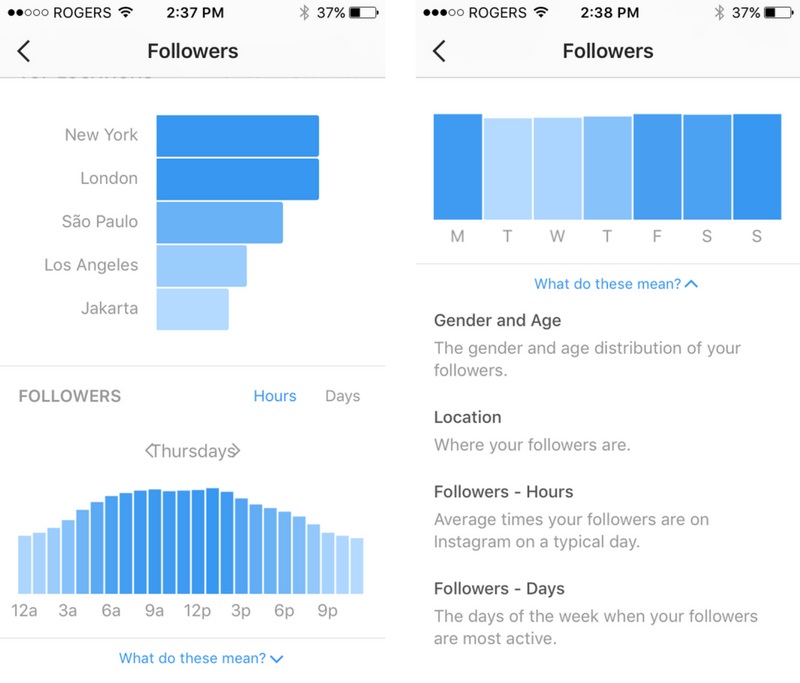
There are the fewest questions about the audience dimension because the section provides basic information about people. Thanks to statistics, it turns out to find out not only the most accurate location of active users, but also their age. This helps to more correctly formulate the texts of publications, to attract attention with the help of subtle techniques. After all, the difference between 30+ and 16+ is huge, these are different generations with different interests, as well as trigger topics.
Understanding exactly which users the dialogue is going on makes it possible to influence correctly, to determine in the future groups that can be attracted to the page using targeting.
Also, the statistics reflect the growth – the number of people who have joined the profile, as well as the days of these events. This makes it possible to calculate which advertising campaign was effective, as well as on which days you can expect more newcomers.
A correct understanding of statistical data gives all the opportunities for successful promotion. Accurate information about people, their interests and topics of concern is valuable information, which is also provided by the platform for free.